
newim = filter2(fspecial('gaussian', size(im), 4), im);

EDGE(newim,'canny',[0.0500 0.1250])

newimhori = filter2([-1 0 1], newim);

newimvert = filter2([-1; 0; 1], newim);
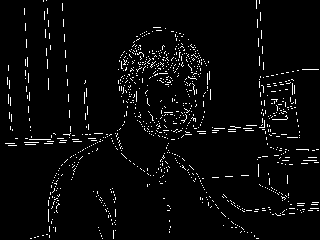
The aim of this laboratory session is to experiment with edge detection and implement the Hough transform for finding lines in images.
Guassian filter with standard deviation 4
newim = filter2(fspecial('gaussian', size(im), 4), im); |
EDGE(newim,'canny',[0.0500 0.1250]) |
newimhori = filter2([-1 0 1], newim); |
newimvert = filter2([-1; 0; 1], newim); |
Guassian filter with standard deviation 6
 newim = filter2(fspecial('gaussian', size(im), 6), im); |
 EDGE(newim,'canny',[0.0500 0.1250]) |
 newimhori = filter2([-1 0 1], newim); |
 newimvert = filter2([-1; 0; 1], newim); |
 newim = filter2(fspecial('gaussian', size(im), 8), im); |
 EDGE(newim,'canny',[0.0500 0.1250]) |
 newimhori = filter2([-1 0 1], newim); |
 newimvert = filter2([-1; 0; 1], newim); |
Without any guassian filtering
Listing of hough.m
% HOUGH
%
% Function takes a grey scale image, constructs an edge map by applying
% the Canny detector, and then constructs a Hough transform for finding
% lines in the image.
%
% Usage:  h = hough(im, Thresh, nrho, ntheta)
%
% arguments:
%            im     - The grey scale image to be transformed
%            Thresh - A 2 -vector giving the upper and lower
%                     hysteresis threshold values
%            nrho   - Number of quantised levels of rho to use
%            ntheta - Number of quantised levels of theta to use
%
% returns;
%            h      - The Hough transform
%
% An x value corresponds to a column number
% An y value corresponds to a row number

function h = hough(im, Thresh, nrho, ntheta)
    BW = EDGE(im,'canny', Thresh);

    [rows, cols] = size(im);

    h = zeros(nrho, ntheta);


    rhomax = sqrt(rows^2 + cols^2);    % The maximum possible value of rho.
    drho =  2*rhomax/(nrho-1);         % The increment in rho between successive entries
                                       % in the accumulator matrix. Remember we go between
                                       % +-rhomax.

    dtheta = pi/ntheta;                % The increment in theta between entries.
    theta = [0:dtheta:(pi-dtheta)];    % Array of theta values across the accumulator matrix.

    % To convert a value of rho or theta to its appropriate index in the array use:
    % rhoindex = round(rho/drho + nrho/2);
    % thetaindex = round(theta/dtheta + 1);


    for i = 1:rows
        for j = 1:cols
            if BW(i, j)                         % for each non-zero point
                for thetaindex = 1:ntheta
                    rho = j*cos(theta(thetaindex)) + i*sin(theta(thetaindex));
                    rhoindex = round(rho/drho + nrho/2);
                    h(rhoindex, thetaindex) = h(rhoindex, thetaindex) + 1;
                end
            end
        end
    end
Listing on houghlines.m
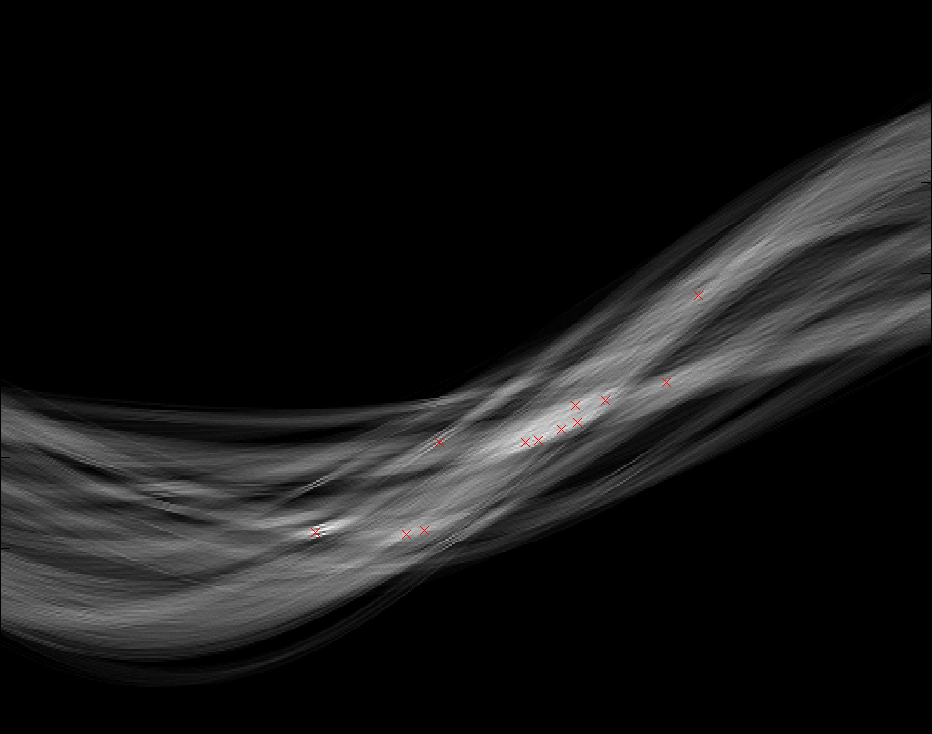
% HOUGHLINES
%
% Function takes an image and its Hough transform, finds the
% significant lines and draws them over the image
%
% Usage:   houghlines(im, h, thresh)
%
% arguments:
%             im     - The original image
%             h      - Its Hough Transform
%             thresh - The threshold level to use in the Hough Transform to
%                      decide whether an edge is significant

function  houghlines(im, h, thresh)

    [rows, cols] = size(im);
    [nrho, ntheta] = size(h);

    rhomax = sqrt(rows^2 + cols^2);
    drho =  2*rhomax/(nrho-1);

    dtheta = pi/ntheta;                % The increment in theta between entries.
    theta = [0:dtheta:(pi-dtheta)];    % Array of theta values across the accumulator matrix.

    [rhoindex,thetaindex] = nonmaxsuppts(h, 7, thresh)

    rho = drho*(rhoindex' - nrho/2);
    theta = dtheta*(thetaindex' - 1);

    x = [0; cols]*ones(1, length(rhoindex))
    y = [rho./sin(theta); (rho - x(2,:).*cos(theta))./sin(theta)]

    figure(1)
    imagesc(h), colormap(gray);
    hold
    plot(thetaindex, rhoindex,'rx')
    hold
    figure(2)
    imshow(im)
    line(x, y,'Color','r')

Which does not produce the desired results, not sure why.
edge threshold input [0.0125 0.0313]
maxpoint threshold 230